


Abstract
Tumor cells recapitulate cell-lineage transcriptional programs that are characteristic of normal tissues from which they arise. It is unclear why such lineage programs are fatefully maintained in tumors and if they contribute to cell proliferation and viability.
Here, we used the most common brain tumor, meningioma, which is strongly associated with female sex and high body mass index (BMI), as a model system to address these questions. We screened expression profiling data to identify the transcription factor (TF) genes which are highly enriched in meningioma, and characterized the expression pattern of those TFs and downstream genes in clinical meningioma samples as well as normal brain tissues. Meningioma patient-derived cell lines (PDCLs) were used for further validation and characterization.
We identified 8 TFs highly enriched in meningioma. Expression of these TFs, which included sine oculis homeobox 1 (SIX1), readily distinguished meningiomas from other primary brain tumors and was maintained in PDCLs and even in pulmonary meningothelial nodules. In meningioma PDCLs, SIX1 and its coactivator eyes absent 2 (EYA2) supported the expression of the leptin receptor (LEPR), the cell-surface receptor for leptin (LEP), the adipose-specific hormone that is high in women and in individuals with high BMI. Notably, these transcriptional regulatory factors, LEPR and LEP, both contributed to support meningioma PDCLs proliferation and survival, elucidating a survival dependency on both a core transcriptional program and a metabolic cell-surface receptor.
These findings provide one rationale for why lineage TF expression is maintained in meningioma and for the epidemiological association of female sex and obesity with meningioma risk.
We use meningioma as a model system to demonstrate that cell lineage TFs can contribute to non-oncogene-driven growth. Our findings also provide one rationale for why lineage TF expression is maintained during meningioma development and for the epidemiological association of female sex and obesity with meningioma risk.
Transcription factors (TFs) that are expressed in normal tissues are also often expressed in tumors arising in those tissues. This phenomenon occurs across tumor types of diverse histology that are driven by wide-ranging molecular and genetic aberrations. Some examples of lineage TFs that are fatefully expressed in tumors are PAX8 in urogenital tumors, MYOD in skeletal muscle tumors, MITF in melanoma,1CRX in retinal and pineal tumors,2FOXJ1 in ependymal and choroid plexus tumors,3 and Olig2 in many glial tumors.4
The expression of lineage TFs can be suppressed, however, during tumor progression. Such suppression in subpopulations of tumor cells results in phenotypic and functional heterogeneity.5 When some tumors become overtly de-differentiated, the TF suppression is widespread.6 The mechanisms that foster well-differentiated states and that favor preservation of lineage states remain largely unresolved.
Meningiomas are the most common intracranial tumor, accounting for over one-third of brain tumors.7 Most meningiomas are low-grade, slow-growing tumors that retain well-differentiated histologic features suggesting that there are powerful factors that maintain the expression of lineage programs and the differentiated state. Among higher-grade meningiomas, only a small subset develops the histologic features of overt de-differentiation, a state with primitive malignant cells as the major component.8–11 However, many higher-grade meningiomas presumably undergo shifts in differentiation that are not readily recognizable upon histologic review, yet which may influence malignant behavior. Assessing the extent of such shifts requires the identification of TFs that reliably capture the differentiation status of the meningioma cells. Knowledge of these TFs would advance our understanding of the pathogenesis of this very common tumor. Monitoring meningioma differentiation status could provide a better assessment of tumor recurrence, malignant potential, and therapeutic vulnerabilities.
Several risk factors for meningioma development, such as radiation exposure, are well established.12 Additional risk factors such as female sex and elevated body mass index (BMI)7,13,14 strongly suggest a role for systemic metabolic factors in supporting meningioma growth. Individuals with a high BMI have an elevated risk of developing meningioma, with obesity conferring a relative risk of >1.5.13–16 Some of the impact on meningioma growth has been attributed to female sex hormones, largely progesterone-based mechanisms; however, the data are conflicted and a clear mechanistic link is lacking.
In this work, we identified a core set of TFs, including sine oculis homeobox 1 (SIX1), that are widely expressed in low-grade meningiomas and are maintained in patient-derived cell lines (PDCLs). Expression of these TFs was suppressed in aggressive meningiomas. SIX1 and its coactivator eyes absent (EYA) transcriptional coactivator and phosphatase 2 (EYA2) supported the expression of the leptin receptor (LEPR), which along with its ligand, leptin (LEP), fostered the growth of PDCLs. Our findings demonstrate a functional link between meningioma TF expression and systemic metabolic cues and reveal a constraint that supports a well-differentiated state in meningioma.
Materials and Methods
Patient Cohorts, Clinical Tissue Samples, Tissue Microarrays, and Cell Lines
The study was approved by the institutional review boards of Brigham and Women’s Hospital and Dana-Farber Cancer Institute. Tissue microarrays HTMA283/HTMA285 were previously described.17,18 Clinicopathological information was collected from clinical records (Supplementary Tables S1, S2) using an excess tissue protocol; PDCLs were generated from patients who provided informed consent. Board-certified neuropathologists (S.S. and M.A.) reviewed the cases. For RNAseq analysis, we obtained 22 frozen meningioma and 9 frozen solitary fibrous tumor (SFT) samples from the Brigham and Women’s Hospital Tumor Bank, which were collected after informed consent had been obtained (Supplementary Table S3). Publicly available RNAseq data for ependymoma19 were accessed from St Jude Medical Center.
Meningioma PDCLs were cultured in Dulbecco's Modified Eagle Medium (DMEM) (Life Technologies) containing 20% fetal bovine serum and 1% penicillin/streptomycin solution (Supplementary Table S4) at 37°C with 5% CO2. Transfection and stable cell line generation are described in the Supplementary File S1.
RNA Sequencing Analysis and Microarray Data Analysis
RNA libraries construction and sequencing methods are described in the Supplementary File S1. The analysis of microarray expression profiling data from publicly available datasets cataloged in the Gene Expression Omnibus (GEO) is described in the Supplementary File S1 and has been previously described.3,20
Gene-Gene Correlation in Celsius
Gene-gene correlation in Celsius data was analyzed by the UCLA Gene Expression Tool (UGET) (http://genome.ucla.edu/projects/UGET) as previously described21,22 and listed in Supplementary Table S5.
Immunofluorescence, Immunohistochemistry, RNA In Situ Hybridization, and Quantitative Real-Time PCR
Primary antibodies and the methods for staining, scoring, and t-distributed stochastic neighbor embedding (t-SNE) analysis and the RNAscope, as well as information about qRT-PCR assays and TaqMan assays/methods are listed in the Supplementary File S1.
Cell Viability Assay, Apoptosis Detection Assay, and Cell Cycle Assay
CellTiter-Glo Cell Viability Assay (Promega, cat# G7573) was used to assess relative cell number (see Supplementary File S1) after small interfering (si)RNA (Supplementary Table S6) or short hairpin (sh)RNA knockdown (Supplementary Table S7). Annexin V–Cy3 Apoptosis Detection Kit with SYTOX (Abcam, cat# ab14144) was used for apoptosis detection assay, and the MUSE Cell Cycle Assay Kit (Millipore, cat# MCH100106) was used for cell cycle analysis (see Supplementary File S1) of shRNA knockdown cells.
Statistical Analysis
We analyzed data using GraphPad Prism 6 and SPSS 12.0 (see Supplementary File S1). Overall survival analysis was based on disease-specific survival.
Results
Transcription Factors Enriched in Meningioma
To identify TFs which are highly expressed in meningioma, we analyzed mRNA data from publicly available datasets cataloged in GEO, which included 68 meningioma and 282 other brain tumor/normal samples (Supplementary Table S8). Based on a ranked gene list of enrichment scoring23 (Supplementary Table S9) and statistical differential expression analysis (Supplementary Table S10), we found 8 TFs (SIX1, SIX2, FOXC1, FOXC2, FOXD1, BNC2, MEOX2, and KLF5) that were most significantly highly enriched in meningioma (Fig. 1A, Supplementary Fig. S1A).
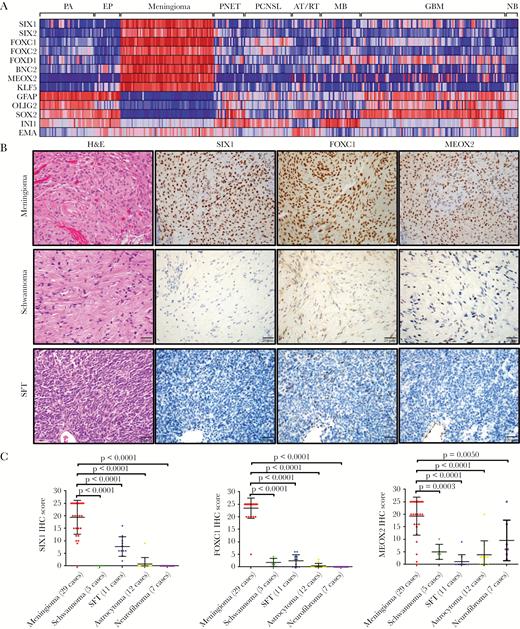
Identification of transcription factors (TFs) that are highly enriched in meningioma. (A) Heat map of microarray data (GEO) indicated that 8 TFs were highly enriched in meningioma compared with pilocytic astrocytoma (PA), ependymoma (EP), primitive neuroectodermal tumor (PNET), primary CNS lymphoma (PCNSL), medulloblastoma (MB), atypical teratoid rhabdoid tumor (AT/RT), and glioblastoma (GBM) as well as with normal brain (NB). Each column represents an individual sample. (B) IHC staining from meningioma, schwannoma, and solitary fibrous tumor (SFT) indicated that SIX1, FOXC1, and MEOX2 proteins are highly expressed in meningioma. (C) Semiquantitative scoring of IHC for SIX1, FOXC1, and MEOX2 from different neural tumors.
Identification of transcription factors (TFs) that are highly enriched in meningioma. (A) Heat map of microarray data (GEO) indicated that 8 TFs were highly enriched in meningioma compared with pilocytic astrocytoma (PA), ependymoma (EP), primitive neuroectodermal tumor (PNET), primary CNS lymphoma (PCNSL), medulloblastoma (MB), atypical teratoid rhabdoid tumor (AT/RT), and glioblastoma (GBM) as well as with normal brain (NB). Each column represents an individual sample. (B) IHC staining from meningioma, schwannoma, and solitary fibrous tumor (SFT) indicated that SIX1, FOXC1, and MEOX2 proteins are highly expressed in meningioma. (C) Semiquantitative scoring of IHC for SIX1, FOXC1, and MEOX2 from different neural tumors.
To assess the expression of these TFs in a mesenchymal tumor closely related to meningioma, we performed RNAseq on 22 meningiomas and 9 SFTs, a tumor that is morphologically similar to meningioma. For a point of reference, we included publicly available RNAseq data from ependymomas.19 While SIX1 and BNC2 mRNA expression was observed to a modest degree in several SFTs, the overall expression of mRNA for these TFs was highly enriched in meningioma (Supplementary Fig. S1B).
Next, in whole tissue sections of a panel of tumors, we used immunohistochemistry (IHC) to assess protein expression levels of several of these TFs (SIX1, FOXC1, and MEOX2). Similar to the pattern of mRNA expression, the proteins for these TFs were also highly enriched in meningioma (Fig. 1B, C). Moreover, these TFs were expressed in both common and uncommon subtypes of meningioma (Supplementary Fig. S2), suggesting broad applicability for assessing meningothelial lineage.
Meningioma Transcription Factors Are Expressed in Normal and Non-Neoplastic Meningeal Tissues
To investigate whether the TFs that we identified in meningioma are also expressed in normal meningeal tissues, we assessed publicly available in situ hybridization (ISH) images from E14.5 mouse embryos. We observed that mRNA from all 8 meningioma TFs was detected to various levels in developing mouse meninges (Supplementary Fig. S3A, S4). In adult human meninges, we used IHC and immunofluorescence imaging to show that SIX1, FOXC1, and MEOX2 proteins are well expressed (Supplementary Fig. S3B).
We also investigated the expression of the TFs in very small meningothelial nodules that can be found incidentally in some resected lung tissues. These nodules are found in patients undergoing resections for primary lung cancers or metastatic disease in the lung. We found that these reactive, nonneoplastic pulmonary meningothelial proliferations also strongly expressed SIX1, FOXC1, and MEOX2 proteins (Supplementary Fig. S3C), further supporting that the TFs that we identified are biomarkers of meningothelial lineage, even in noncranial sites.
De-Differentiation of Higher-Grade Meningiomas Detected by Reduced Levels of Lineage Markers
We next investigated the expression pattern of these meningioma TFs by IHC in a cohort of 178 meningiomas (Supplementary Tables S2, S11, S12; Fig. 2, Supplementary Fig. S5) and assessed associations with tumor-related overall survival. We also assessed the expression of epithelial membrane antigen (EMA), which is a well-established meningioma diagnostic marker (Supplementary Fig. S5A).
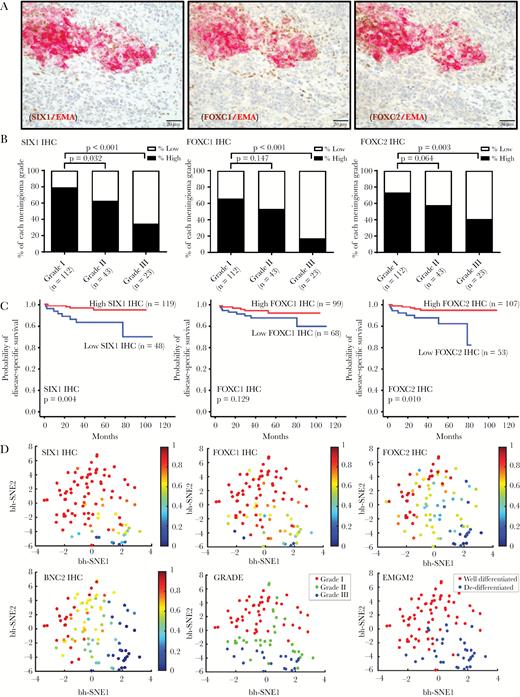
Expression of TF proteins is suppressed in anaplastic meningioma. (A) Double IHC stains of SIX1, FOXC1, FOXC2, and EMA in a meningioma with heterogeneous morphology and immunostaining.8 (B) Semiquantitative scoring data for SIX1, FOXC1, and FOXC2 IHC from 178 meningiomas is plotted by tumor grade, separating high and low expressors for each TF. (C) Kaplan–Meier plots showing overall survival for patients who were high and low expressors. (D) t-SNE plot of 99 meningioma samples showing reduced TF expression in high-grade meningiomas, correlating with grade and differentiation status. The relative expression level of the indicated TF is mapped to color. Each dot reflects a single case.
Expression of TF proteins is suppressed in anaplastic meningioma. (A) Double IHC stains of SIX1, FOXC1, FOXC2, and EMA in a meningioma with heterogeneous morphology and immunostaining.8 (B) Semiquantitative scoring data for SIX1, FOXC1, and FOXC2 IHC from 178 meningiomas is plotted by tumor grade, separating high and low expressors for each TF. (C) Kaplan–Meier plots showing overall survival for patients who were high and low expressors. (D) t-SNE plot of 99 meningioma samples showing reduced TF expression in high-grade meningiomas, correlating with grade and differentiation status. The relative expression level of the indicated TF is mapped to color. Each dot reflects a single case.
We found that EMA was highly expressed in grade I meningioma and reduced in grade III meningioma (P = 0.02), supporting altered differentiation in high-grade meningiomas (Supplementary Fig. S5A). Furthermore, in high-grade meningiomas with heterogeneous EMA expression, double staining for EMA and several of the meningioma TFs revealed that EMA-expressing meningioma cells frequently coexpressed SIX1, FOXC1, and FOXC2 (Fig. 2A), whereas meningioma cells lacking EMA expression generally had low TF expression as well (Fig. 2A).
In this cohort, we found that protein levels of the meningioma TFs SIX1, FOXC1, FOXC2, and BNC2 were each highly expressed in grade I meningiomas but were lower in grade III meningiomas (P < 0.001, P < 0.001, P = 0.003, and P < 0.001, respectively) (Supplementary Tables S11, S12; Fig. 2B, Supplementary Fig. S5B). In contrast, MEOX2 and KLF5 were strongly expressed in grade I and grade III tumors (Supplementary Table S11; Supplementary Fig. S5B).
In this cohort, we also investigated by ISH the expression of mRNA for 2 of these TFs, SIX1 and FOXC2, and for FOXD1, for which we were unable to validate an IHC antibody (Supplementary Tables S12, S13; Supplementary Fig. S6). Messenger RNA and protein expression levels of SIX1 and FOXC2 were highly correlated (Supplementary Fig. S7). The mRNA levels of each of these TFs was significantly lower in grade III versus grade I tumors (P = 0.025, P = 0.007, P = 0.028, respectively) (Supplementary Table S13, Supplementary Fig. S6). Of the 4 TFs with suppressed protein expression, low SIX1 protein (P = 0.004) and low FOXC2 protein levels (P = 0.010) were associated with worse patient outcome (Supplementary Table S2, Fig. 2C).
We used t-SNE, an algorithm for dimensionality reduction, to assess and visualize the differentiation status of the meningioma resections. We generated a t-SNE plot from the protein (IHC) and mRNA (RNAscope) data and mapped expression of each marker to color (Fig. 2D, Supplementary Fig. S5D, S6D). SIX1, FOXC1, FOXC2, and BNC2 expressions were reduced in high-grade meningiomas and correlated with grade and differentiation status (Fig. 2D). Notably, using unsupervised clustering with expectation-maximization Gaussian mixture (EMGM) modeling, we showed that meningioma resections separated into well-differentiated cluster and de-differentiated clusters (Fig. 2D).
Taken together, our analysis highlights 8 TFs that may be part of a core lineage program for meningothelial differentiation in normal tissues and in neoplasms. Suppression of several of these TFs, such as SIX1, FOXC1, FOXC2, FOXD1, and BNC2 taken individually or as a panel, allows for monitoring meningioma differentiation status.
Meningioma TF Expression Is Strongly Correlated with Expression of LEPR and PTGDR
To gain insights into functional programs that may be governed by the meningioma TFs, we generated an mRNA expression correlation matrix from a meta-analysis of publicly available expression profiling data.21 Using UGET, we queried approximately 12000 human expression profiles available through the Celsius database.21
This analysis revealed that the meningioma TFs are frequently coexpressed (Supplementary Tables S5, S14; Fig. 3A). Moreover, expression of these TFs was most highly correlated with the expression of 2 cell-surface receptors—the prostaglandin D2 receptor (PTGDR) and LEPR (Supplementary Tables S5, S14; Fig. 3A). In our mRNA expression data, we confirmed a strong correlation between the expression of meningioma TFs and the expression of PTGDR and LEPR mRNA supporting that these 2 receptors are highly enriched in meningiomas but not in SFT (Supplementary Table S15, Fig. 3B, C). A subset of atypical teratoid rhabdoid tumor expressed moderate levels of LEPR, and PTGDR was expressed in a subset of primary central nervous system lymphoma. PTGDR is the receptor for prostaglandin D2, a mediator of allergic inflammation that is produced by mast cells.24 Others have shown25 and we confirmed here that mast cells frequently infiltrate meningiomas (Supplementary Fig. S8).
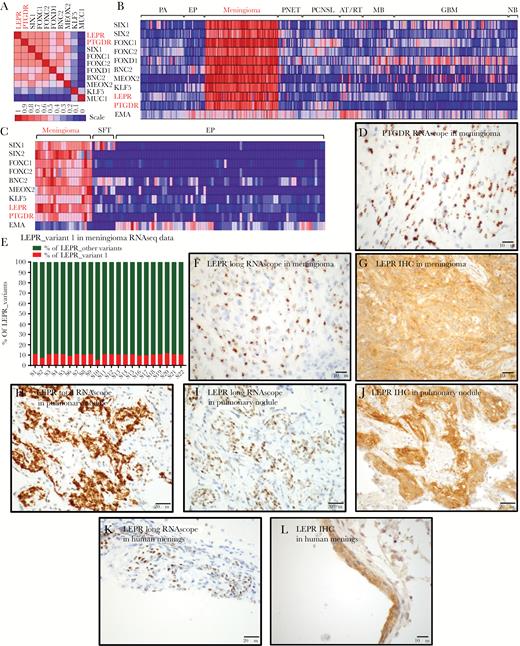
LEPR and PTGDR expression in meningothelial tissues. (A) Heat map of gene-gene correlation using 12000 human expression profiles in the Celsius database, using UGET. (B) Heat map of brain tumor microarray data in GEO, including meningioma TFs and LEPR, PTGDR, and EMA. (C) Heat map of RNAseq data from meningiomas, SFTs, and ependymomas showing relative expression levels of 7 transcriptional factors and LEPR, PTGDR, and EMA (D) ISH for PTGDR mRNA transcripts in a grade I meningioma using RNAscope. (E) Plot of percent LEPR long-form/variant-1 relative to total LEPR levels, calculated from RNA-splicing data using differential splicing analysis (JuncBASE). (F) ISH for LEPR long-form mRNA transcripts in a grade I meningioma using an RNAscope probe recognizing the LEPR long form and not other splice variants of LEPR. (G) IHC staining for total LEPR protein in grade I meningioma. (H) ISH for LEPR total mRNA transcripts and (I) LEPR long-form mRNA transcripts and (J) IHC for total LEPR protein in a pulmonary meningothelial nodule. (K) ISH for LEPR long-form mRNA transcripts and (L) IHC staining for total LEPR protein in human meninges.
LEPR and PTGDR expression in meningothelial tissues. (A) Heat map of gene-gene correlation using 12000 human expression profiles in the Celsius database, using UGET. (B) Heat map of brain tumor microarray data in GEO, including meningioma TFs and LEPR, PTGDR, and EMA. (C) Heat map of RNAseq data from meningiomas, SFTs, and ependymomas showing relative expression levels of 7 transcriptional factors and LEPR, PTGDR, and EMA (D) ISH for PTGDR mRNA transcripts in a grade I meningioma using RNAscope. (E) Plot of percent LEPR long-form/variant-1 relative to total LEPR levels, calculated from RNA-splicing data using differential splicing analysis (JuncBASE). (F) ISH for LEPR long-form mRNA transcripts in a grade I meningioma using an RNAscope probe recognizing the LEPR long form and not other splice variants of LEPR. (G) IHC staining for total LEPR protein in grade I meningioma. (H) ISH for LEPR total mRNA transcripts and (I) LEPR long-form mRNA transcripts and (J) IHC for total LEPR protein in a pulmonary meningothelial nodule. (K) ISH for LEPR long-form mRNA transcripts and (L) IHC staining for total LEPR protein in human meninges.
We further characterized the expression of PTGDR and LEPR in meningioma resection samples. PTGDR mRNA was strongly expressed in meningioma tumor cells (Fig. 3D). Six LEPR splice variants have been described26 (Supplementary Fig. S9A), of which the long-form/variant-1 LEPR transcript is regarded as a functional isoform capable of signal transduction. In our RNAseq data from 22 meningioma samples, mRNA isoform splicing analysis showed that the long-form/variant-1 LEPR transcript comprised 5%–12% of the total LEPR transcripts (Fig. 3E, Supplementary Table S16). We confirmed this finding using an ISH probe that specifically recognized the long form of LEPR (Fig. 3F, Supplementary Fig. S9A). In addition, using an antibody that recognizes total LEPR protein, we demonstrated robust LEPR protein expression in meningioma cells (Fig. 3G). Moreover, we detected both total LEPR (Fig. 3H) and long-form LEPR (Fig. 3I) mRNA and LEPR protein (Fig. 3J) in pulmonary meningothelial nodules as well as in normal human meninges (Fig. 3K, L).
We investigated the pattern of PTGDR and LEPR expression in the 178 meningioma samples. Similar to the reduced TF expression that we observed in high-grade meningiomas, PTGDR mRNA was highly expressed in grade I meningioma and reduced in grade III meningioma (P = 0.004) (Fig. 4A). LEPR total mRNA, long-form mRNA, and protein expression were highly correlated among each other (Supplementary Fig. S9B) and all were highly expressed in grade I meningioma and reduced in grade III meningioma (P < 0.001). The expressions of PTGDR and LEPR in low-grade meningioma and their loss in high-grade meningioma were visualized in t-SNE plots (Fig. 4A–D). In addition, as we showed with SIX1 and FOXC2, low LEPR total and LEPR long-form mRNA and LEPR protein were all associated with poor patient prognosis (P = 0.006, P = 0.009, P = 0.038) (Fig. 4B–D). Consistent with this finding, SIX1 levels were highly correlated with those of PTGDR and LEPR (Supplementary Fig. S10, S11).
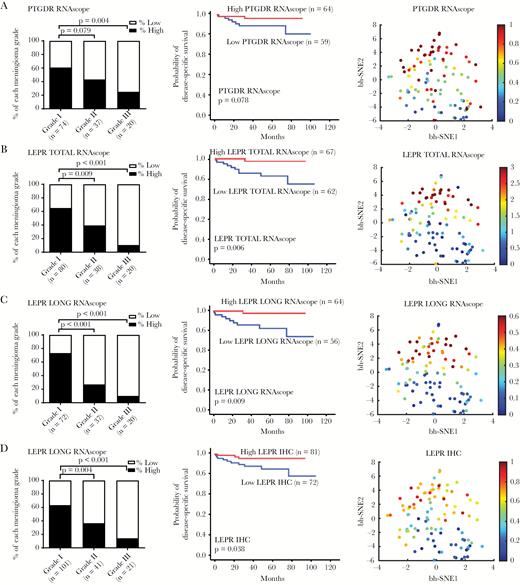
LEPR and PTGDR expression are suppressed in anaplastic meningioma. Digital scoring data of the ISH signals (average dots per cell) showing the percentage of high and low expressor cases for (A) PTGDR mRNA, (B) total LEPR mRNA, and (C) LEPR long-form splice variant mRNA and (D) IHC for LEPR total protein in different grades meningiomas. Kaplan‒Meier plots showing overall survival for high and low expressors of each biomarker and t-SNE plot of the biomarker distribution.
LEPR and PTGDR expression are suppressed in anaplastic meningioma. Digital scoring data of the ISH signals (average dots per cell) showing the percentage of high and low expressor cases for (A) PTGDR mRNA, (B) total LEPR mRNA, and (C) LEPR long-form splice variant mRNA and (D) IHC for LEPR total protein in different grades meningiomas. Kaplan‒Meier plots showing overall survival for high and low expressors of each biomarker and t-SNE plot of the biomarker distribution.
Association of Meningothelial Nodules with High Body Mass Index
LEPR is the receptor for leptin (LEP), an adipocyte-specific secreted protein that plays a major role in the regulation of body weight27 and can also function as a growth factor by activating signaling pathways involved in cell cycle regulation.28 A number of studies have established a strong positive association between BMI and meningioma development.13–16 Similar to the strong association of meningioma with female sex and obesity, we found a similar strong association in 46 patients who had incidental pulmonary meningothelial nodules identified in a pulmonary resection. These patients were more likely to be female (39 females, 7 males; P < 0.0001) and had higher BMI than a sex-matched control group that had lung tissue resections lacking meningothelial nodules (mean BMI = 31.45 vs 26.0; P < 0.0001; Supplementary Fig. S12, Supplementary Table S17).
SIX1 and EYA2 Regulate LEPR and PTGDR Expression in Grade I Meningioma
We next investigated whether SIX1 can regulate LEPR and PTGDR expression. We generated a panel of primary meningioma cell lines from resection tissues (Supplementary Table S4). We selected 3 PDCLs (MG8, MG14, and MG15) that adapted well to growth in cell culture for further characterization.
Using quantitative PCR and immunofluorescence we showed that these PDCLs maintained expression of SIX1, FOXC1, and FOXC2 (Fig. 5A, Supplementary Fig. S13). In addition, these PDCLs expressed mRNA transcripts for the other meningioma TFs (Supplementary Fig. S13A), as well as PTGDR, total LEPR, and the LEPR long form (Supplementary Fig. S14). Expression of these genes was also detected in RNAseq data derived from PDCLs (Supplementary Fig. S15), and TF mRNA and protein were observed in all other meningioma PDCLs tested from our collection (Supplementary Fig. S16).
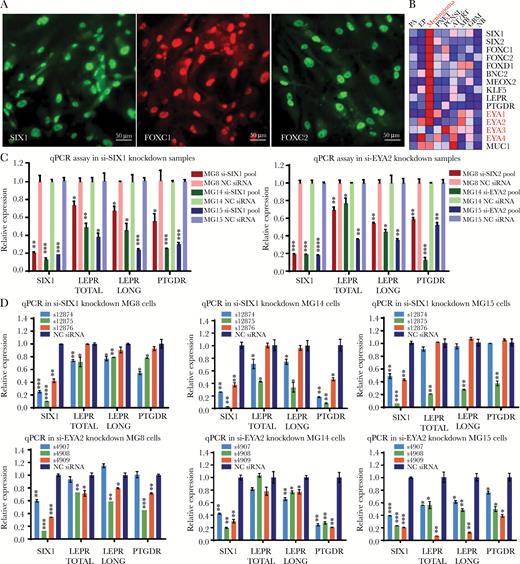
Both SIX1 and its coactivator EYA2 support LEPR and PTGDR expression in grade I meningioma cell lines. (A) Immunofluorescence of meningioma TFs SIX1, FOXC1, and FOXC2 in meningioma cell line MG8 (scale bar 50 μm). (B) Heat map of expression profiling data showing the average expression in 9 brain tumor types and in normal brain highlighting mRNA expression levels for EYA1–4 (Supplementary Table S8). Quantitative PCR analysis of expression levels of mRNA for total LEPR, LEPR long form, and PTGDR 72 hours following transfection of cell lines (MG8, MG14, and MG15) with (C) siRNA pools targeting SIX1 or EYA2 or (D) 3 different individual siRNAs targeting SIX1 or EYA2.
Both SIX1 and its coactivator EYA2 support LEPR and PTGDR expression in grade I meningioma cell lines. (A) Immunofluorescence of meningioma TFs SIX1, FOXC1, and FOXC2 in meningioma cell line MG8 (scale bar 50 μm). (B) Heat map of expression profiling data showing the average expression in 9 brain tumor types and in normal brain highlighting mRNA expression levels for EYA1–4 (Supplementary Table S8). Quantitative PCR analysis of expression levels of mRNA for total LEPR, LEPR long form, and PTGDR 72 hours following transfection of cell lines (MG8, MG14, and MG15) with (C) siRNA pools targeting SIX1 or EYA2 or (D) 3 different individual siRNAs targeting SIX1 or EYA2.
SIX1 interacts with the 4 members of the EYA coactivator family to regulate gene expression and cellular proliferation. In our mRNA expression profiling data, we found that both EYA1 and EYA2, but not EYA3 and EYA4, were highly enriched in meningioma (Fig. 5B, Supplementary Fig. S17), with EYA2 expression being highest in meningioma PDCLs (Supplementary Fig. S14).
We used individual and pools of siRNA to reduce SIX1 and EYA2 levels in the meningioma PDCLs (Fig. 5C,D, Supplementary Fig. S13A), which significantly reduced the mRNA levels of total LEPR, LEPR long form, and PTGDR (Fig. 5C, D). These data support that SIX1 and its transcriptional coactivator EYA2 can regulate the expression of LEPR and PTGDR in meningioma PDCLs.
SIX1/EYA2 Supports Cell Growth in Grade I Meningioma Through LEPR/PTGDR
To investigate the effects of reduction of SIX1, we generated PDCLs that stably express 3 different lentivirus shRNAs targeting SIX1 (C5, C8, and F6) (Fig. 6A, Supplementary Fig. S18A). Two of the SIX1 hairpins (C5 and F6) yielded significant knockdown of SIX1 (Supplementary Fig. S18A). While the hairpin C8 that did not affect SIX1 levels had no effect on growth, the hairpins C5 and F6 each significantly reduced the relative viable cell number (Fig. 6A) and induced G2/M arrest and apoptosis (Supplementary Fig. S19). This relative reduction was confirmed using transient transfection of multiple individual siRNA targeting SIX1 (Fig. 6B). Consistent with this, siRNA targeting EYA2 also significantly reduced the relative viable cell number (Fig. 6C).
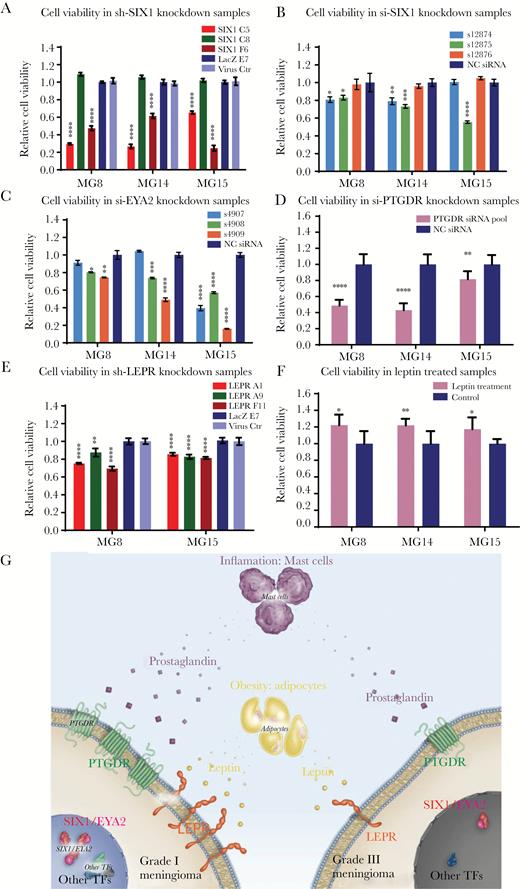
SIX1, EYA2, LEPR, and PTGDR and supplementation with recombinant human leptin protein support cell survival and proliferation in grade I meningioma cell lines. (A) Cell viability of meningioma PDCLs with stable SIX1 knockdown. Cell viability of meningioma PDCLs 5 days following transfection with (B) 3 different individual siRNAs targeting SIX1, (C) 3 different individual siRNAs targeting EYA2, and (D) siRNA pools targeting PTGDR. (E) Cell viability of meningioma PDCLs with stable knockdown of LEPR. (F) Cell viability following treatment of meningioma PDCLs incubated in serum-free media supplemented and refreshed with 75 nM of recombinant human leptin for 7 days. (G) Schematic of a model of meningioma pathogenesis indicating differential dependencies between low- and high-grade meningiomas on meningioma TFs, PTGDR, and LEPR.
SIX1, EYA2, LEPR, and PTGDR and supplementation with recombinant human leptin protein support cell survival and proliferation in grade I meningioma cell lines. (A) Cell viability of meningioma PDCLs with stable SIX1 knockdown. Cell viability of meningioma PDCLs 5 days following transfection with (B) 3 different individual siRNAs targeting SIX1, (C) 3 different individual siRNAs targeting EYA2, and (D) siRNA pools targeting PTGDR. (E) Cell viability of meningioma PDCLs with stable knockdown of LEPR. (F) Cell viability following treatment of meningioma PDCLs incubated in serum-free media supplemented and refreshed with 75 nM of recombinant human leptin for 7 days. (G) Schematic of a model of meningioma pathogenesis indicating differential dependencies between low- and high-grade meningiomas on meningioma TFs, PTGDR, and LEPR.
We next investigated the effects of reducing PTGDR and LEPR levels on PDCL growth. Short hairpin RNA transiently targeting PTGDR significantly reduced relative cell viability (Fig. 6D). For LEPR, we transduced the panel of PDCLs with 3 different lentivirus shRNAs that target LEPR and we selected for pools of cells with stable knockdown of LEPR (Supplementary Fig. S18B). The hairpins that reduced LEPR all reduced the relative viable cell number (Fig. 6E).
Finally, we investigated whether supplementing media with recombinant LEP could promote growth of the PDCLs. Consistent with the slow growth demonstrated by meningioma cells in tissue culture and in patients, we found a modest but reproducible dose-dependent increase in relative cell number with LEP treatment (Fig. 6F, Supplementary Fig. S20). These findings suggest that LEP may promote the growth of meningioma cells.
Discussion
Oncogene activation and deranged signaling are fundamental to the development, growth, and progression of tumors. However, nonmutated, non-oncogene systems are also relentlessly engaged during oncogenesis,29 pivotally supporting tumor survival and adaptation. These systems include the proteasome degradation machinery, the ribosome and associated components of the translation control machinery, as well as the transcription factors that control responses to environmental stressors.22,30,31 In this work, we use meningioma as a model system to demonstrate that cell lineage transcription factors can contribute to non-oncogene driven growth by supporting the expression of the LEPR, a cell-surface metabolic receptor.
Only a small portion of meningiomas progress to higher histologic grades and undergo overt de-differentiation, suggesting that there are constraints that restrict de-differentiation and foster phenotypic stability. Such phenotypic stability is certainly multifactorial in origin and is likely due in large part to genetic and epigenetic constraints on the development of malignant characteristics.8–10,32–34 Our data support that transcriptional regulators intrinsic to cell lineage identity can constrain de-differentiation by supporting expression of receptors that are important for meningioma cell survival and proliferation. The strong link between the expression levels of many of these TFs with meningioma grade, particularly SIX1, also highlights the potential value of meningioma lineage markers as a molecular phenotypic differentiation metric for providing diagnostic and prognostic information for patient management.
A well-described but relatively underappreciated risk factor for meningioma is high BMI.7 Recently, in epidemiological/biomarker studies, other groups have also described that LEPR is expressed in low-grade meningioma.35,36 Our work shows that the growth of patient-derived meningioma cell lines generated from low-grade meningiomas is slowed by reducing expression of LEPR and that the ligand for this receptor, LEP, can promote their growth. These findings suggest that LEP may serve as a trophic factor for meningioma.
Notably, serum LEP levels are significantly higher in obese compared with normal-weight people, in women compared with men, in women during pregnancy as well as during the luteal phase of the menstrual cycle.37–41 Thus, the increased risk of meningioma or flare-ups in meningioma size may be conceivably attributable in part to the increased levels of LEP in certain populations and physiological states.
Moreover, we show that patients who had pulmonary meningothelial nodules identified in their lung resections were obese (average BMI >30). Even more so than meningioma, these meningothelial nodules showed a marked predilection for occurring in women (F:M 5.6:1). These lesions expressed the same TFs found in meningiomas, and expressed LEPR. The strong association between BMI and pulmonary nodules further suggests a link between LEP levels and expansion of meningothelial-type cells.
A tumor-promoting role for LEP and LEPR has been proposed in other cancers.42,43 In breast cancer, LEPR expression is enriched in the triple negative subtype and is correlated with poor overall survival.44–46 In contrast, however, in meningioma, LEPR expression is elevated in low-grade tumors and sharply reduced in higher-grade meningiomas. Thus, it appears that high-grade meningiomas likely do not rely on the modest proliferative advantage provided by LEPR and its underlying transcriptional regulators such as SIX1 and EYA2 but rather on the acquisition of potent tumor-promoting genomic aberrations such as loss of cyclin-dependent kinase inhibitor 2A and telomerase reverse transcriptase promoter mutations.8,9 Low- and high-grade meningiomas likely have differential dependencies on the expression of meningioma TFs, PTGDR, and LEPR (Fig. 6G).
This proposed difference in dependencies is consistent with the well-established epidemiological differences between low- and high-grade meningiomas. Unlike low-grade meningiomas, which occur more frequently in leptin-high states (women and obese individuals), higher-grade meningiomas occur more frequently in leptin-low states (men and patients with low BMI). Such differences in hormonal dependencies between tumor types are commonly observed in a range of hormone-dependent cancers such as breast and prostate cancers. The systemic factors that influence meningioma growth may be varied and many. These factor include neutrophilia,47 which is associated with meningioma recurrence, and progestin therapy, which can foster both meningioma growth48 and a shift in mutational spectrum.49,50
Our work suggests that selective pressures placed on tumor cells can foster the maintenance of well-differentiated cell states. A better understanding of well-differentiated tumor cell states and the associated components that foster survival benefits should shed light on the constraints that limit tumor progression and restrain tumor de-differentiation. This understanding may reveal how these potent dependencies are subverted to allow unfettered tumor proliferation.
Supplementary material
Supplementary material is available at Neuro-Oncology online.
Funding
This work was supported by the Brain Science Foundation (S.S.), the Jared Branfman Sunflowers for Life Fund (S.S.), the National Institutes of Health (1R01CA194005) (S.S.), and the Sanad Children’s Cancer Support Association (M.A.).
Conflict of interest statement. The authors declare no conflicts of interest.

